Data processing
High-level multi-temporal Chlorophyll a products
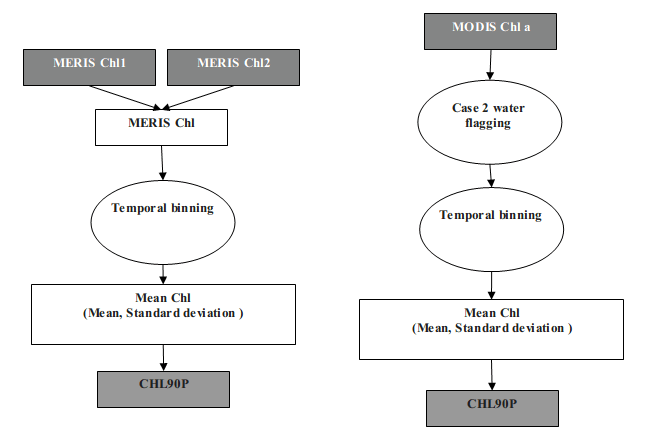
Multi-temporal means (monthly, 3-monthly and annual) are calculated as the arithmetic mean of all acceptable data values over the time period. The 90 percentile chlorophyll a (Chl90P) is calculated from the mean and standard deviation (σ) over the OSPAR growing season (March-October inclusive) by the approximation Chl90P = Mean + 1.28 * σ with minimum number of pixels=2. The standard deviation and mean used for CHL90P calculations are computed in log transformed data.
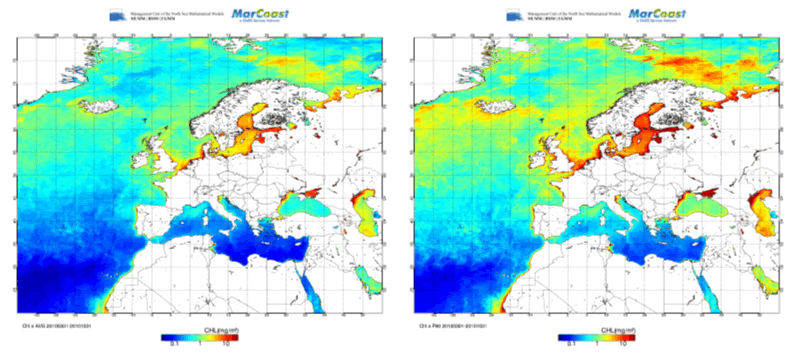
Product examples
Algae Bloom detection and timing products
Input to the service is NRT daily chlorophyll concentration maps and the output is a daily map of 0/1 flags indicating whether AB occurs or not. Other data such as temperature or water-reflectance spectra, which might be useful for detection of species, are not used at the current phase processing but may be used subsequently in service improvements investigated in the EU AQUAMAR project. The processing flow chart is shown below.
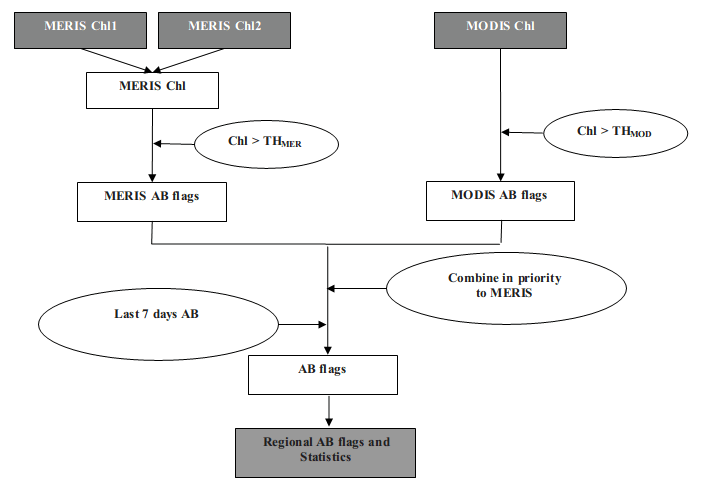
Algal bloom detection is performed by comparison of the near real-time chlorophyll concentration with a reference (threshold) value that is defined a priori. This reference chlorophyll product is the chlorophyll 90 percentile (P90) product based on the satellite chlorophyll measured in a previous year(s). The threshold is sensor specific and variable with location and can thus cope with a large spatial variability of chlorophyll concentration, which is important especially when the target area is large as for the whole European sea water region. Using a sensor specific threshold map for daily AB detection has the advantage of mitigating the effect of systematic errors in satellite Chl caused by yellow substance or mineral particles. For example, using this approach, if one sensor systematically overestimates Chl by a factor, say 30%, or gives a systematic offset or minimal concentration of, say a few mg/m³, in turbid regions, this will make absolutely no difference to the AB detection. Separate threshold maps are thus prepared for each sensor.
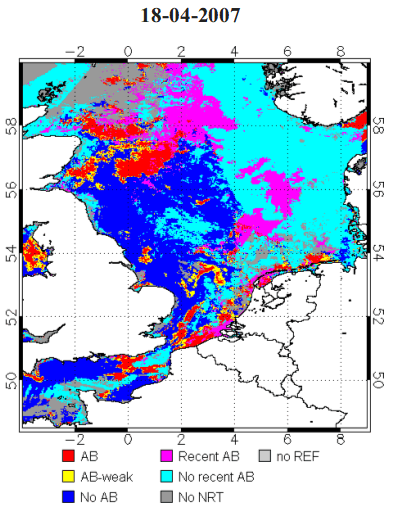
Using the threshold, each pixel is classified as one of three:"Algal Bloom (AB)", "weak Algal Bloom (AB-weak)", "no Algal Bloom (no AB), which have their specific color codes. There are pixels where input Chl may not be available for many reasons such as no satellite observation, cloud cover or bad quality data. For those pixels, the most recent classification from the previous seven days is presented as "recent Algal Bloom (recent AB)" or "no recent Algal Bloom (no recent AB)". In the case that no input data were available within the previous seven days, the pixel is classified as "no NRT. This addition of recent AB information gives a better visual representation of the spatial extent of ongoing algal bloom. The algal bloom detection processing chain is explained in detail in Park et al. (2010). Currently no information is given regarding algal species composition or potential harmfulness. Algal bloom timing is calculated for each year as the Julian day number for the first day when an algae bloom is detected.
Park, Y.J., Ruddick, K., Lacroix, G., 2010. Detection of algal blooms in European waters based on satellite chlorophyll data from MERIS and MODIS. International Journal of Remote Sensing 31(24), pp. 6567-6583.
Product examples