Remote sensing
Introduction
The colour of the sea is usually thought of as blue or green though may in certain circumstances be white, red, yellow, brown and black or any intermediate shade. In fact the colour of water is determined by the electromagnetic interaction of light with the constituent components of water via absorption or scattering processes either within the water column or at the sea surface or bottom. Thus, the optical properties of matter such as algae, certain dissolved organic substances, inorganic suspended particles (e.g. sand, mud, clay) may all affect the water colour. Conversely, by careful measurement of colour, or, more precisely, spectral reflectance, for example by a satellite-based spectroradiometer, and use of appropriate inversion models, it may be possible to estimate remotely these water constituents. This phenomenon is the physical basis for global satellite-based mapping of oceanic chlorophyll concentration, allowing thereby a quantification of phytoplankton at the surface of the world’s oceans and its contribution to the global carbon cycle and hence climate.
Deep oceanic waters have been classified as "Case 1" by Morel and Prieur (1977) because their colour varies essentially only with chlorophyll concentration and chlorophyll estimation from spectral reflectance is now relatively well-established. In contrast, the colour of most coastal waters are also affected by dissolved organic matter originating, for example, from river outflows and from non-algae particles in the water such as resuspended bottom sediments or from river outflows. These are classified as "Case 2" and there is increasing interest in mapping parameters such as chlorophyll in such waters for example to assess the extent and degree of eutrophication and, more generally, the state of the ecosystem. As the Belgian part of the North Sea consists of Case 2 waters, the REMSEM group dedicates substantial research efforts to these topics.
Morel, A. and L. Prieur (1977). Analysis of variations in ocean color. Limnology and Oceanography, 22, 709-722. Download

Expertise in OceanColour
Research and Development (theoretical and applied)
SWIR research
The retrieval of water optical properties and concentrations of in-water constituents from reflectance spectra in coastal waters has been a subject of increased interest in recent research. A critical step in remote sensing of coastal waters is the effective removal of the contribution of the atmosphere to the total signal that reaches the sensor at the top of the atmosphere, i.e. the atmospheric correction process. In open ocean waters the atmospheric correction for ocean colour sensors, such as SeaWiFS and MODIS, has been carried out using the two near-infrared (NIR) bands with assumption of the negligible ocean contributions (black pixel assumption) at the two NIR bands. However, alternative algorithms had to be developed for more turbid waters given that the ocean has significant radiance contributions at the NIR bands. Moreover, it's been realized that as the sediment concentration increases the use of longer wavelength bands for atmospheric correction is needed. The Short Wave Infrared (SWIR, 1-3 um) range offers new opportunities in this regards due to the high absorption of pure water in this spectral region and the lower contribution of ocean substances compared to Visible and Near-InfraRed (VNIR) wavelengths.
The use of SWIR bands for turbid water atmospheric corrections and Total Suspended Matter (TSM) retrieval and the consequent incorporation of SWIR spectral bands into ocean colour satellites is part of REMSEM current research. See also the SEASWIR project.
Near-infrared similarity spectrum
The shape of the water leaving reflectance spectrum in the NIR wavelengths is determined largely by pure water absorption and is thus almost invariant. As such, a universal or "similarity" spectrum in the NIR is defined by normalization at 780nm. This similarity spectrum is calculated from seaborne reflectance measurements and is valid over waters ranging from moderately turbid (water-leaving reflectance at 780nm of order 10-4 or total suspended matter concentration of order 0.3 gm-3) to extremely turbid waters (water-leaving reflectance at 780nm of order 10-1 or total suspended matter concentration of order 200 gm-3). The similarity spectrum is presented in the figure below and can be downloaded here (Source: Ruddick et al., 2006; see publications). Important applications of the NIR similarity spectrum includeatmospheric correction of ocean colour data over turbid waters, quality control of seaborne, airborne, and space borne reflectance measurements in turbid waters.
Relationship between IOPs and TSM
Mass-specific inherent optical properties (IOPs) provide the essential link between optical properties of the water column and the optically significant constituents suspended and dissolved in seawater. This issue is important as conversion models linking optical properties to biogeochemical properties are being used in an accelerated rate both in biogeochemical models with optical modules and in inversion of ocean color to biogeochemical models. Previous studies have demonstrated considerable variability in mass-specific IOPs but the causes of observed variability have been inadequately parameterized. The REMSEM team investigates the causes of variability in mass-specific particulate attenuation and backscattering coefficients with respect to particle size, density and composition for the first time. Based on a large in situ dataset covering a broad range of coastal and offshore waters, it is shown that particle apparent density strongly drives the mass-specific beam attenuation, while particle composition is the main factor driving mass specific backscatter. Overall, recent studies offer new insight into the sources of optical variability in natural waters and contributes to the development of future sampling strategies and algorithm formulation.
Evaluation of Total Suspended matter and Turbidity algorithms in different regions of the world
Regional algorithms have been designed to map TSM (Nechad et al. 2010) and turbidity (T) (Nechad et al. 2009) from in situ or satellite-derived marine reflectance in turbid North Sea waters. In order to test its general applicability, these algorithms have been applied to different coastal regions of the world. They have been tested in the Gulf of Gabés (Tunisia) and in the La Plata River (Argentina) where very high TSM concentration have been reported (100-300 gm-3) providing an interesting extreme case for testing these algorithms. The algorithms are applied to satellite-derived marine reflectance to yield TSM and turbidity maps for each region and, if in situ measurements are available, they are use to validate TSM and T maps and, where necessary, recalibrate the primary algorithm calibration parameter (TSM- or turbidity-specific particulate backscatter).
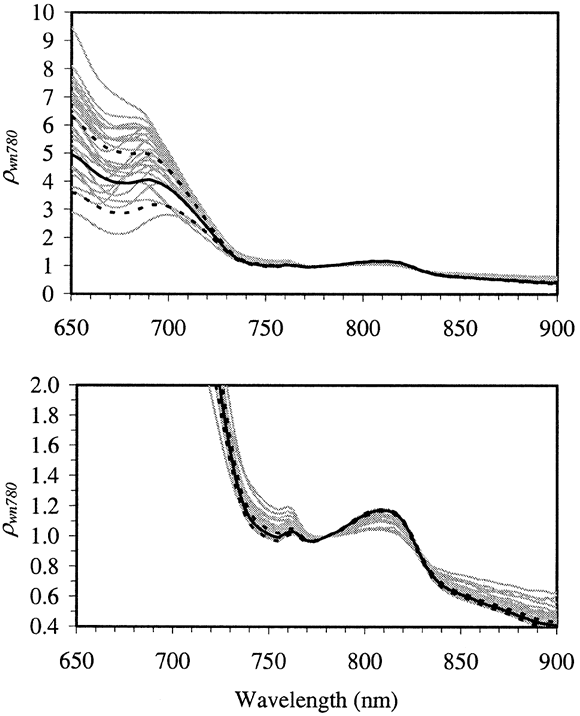
the thick dashed lines.
Underwater light attenuation
The determination of quantity of light available underwater in the visible spectral range is crucial for a wide community of marine users (i.e. ecosystem modelers, sub-marine operations, divers). The photosynthetically available radiation (PAR) is a key parameter in ecosystem modeling and governs, with the nutrient limitation, the primary production. In the proposed model of PAR attenuation (KPAR) a parameterization of the diffuse attenuation of the downwelling attenuation (Kd) has been established using radiative transfer simulations (Hydrolight). Hydrolight was fed by a wide range of inherent optical properties of water (absorption, a, backscattering, bb, Cf IOCCG dataset), and a selection of illumination conditions (sun zenith angles and cloud cover). The generated profiles of downwelling irradiances were then used to calculate Kd at the euphotic depth Zeu1%, the depth at which the downwelling irradiance is 1% of its value at the surface of water. In a second step, a link between Kd at 590nm and KPAR was performed via regression analysis applied to Hydrolight derived Kd and KPAR, which yielded a simple logarithmic relationship between Kd590 and KPAR. Validation of this model is ongoing.
More information in this publication.
In situ observations
Since 2001, REMSEM collects hyperspectral measurements of marine reflectance (above-water), in combination with pigment concentrations and suspended matter concentration. These measurements are used to establish algorithms for the retrieval of e.g. chl a and TSM from remotely sensed imagery. Since 2007, turbidity is also recorded. The figure below shows the Belgian Continental Shelf and the location of the 10 stations which are monitored regularly by the Belgian science Vessel Belgica. With the installation of the so-called "FerryBox", the Belgica becomes one of the leading platforms in the field of autonomous measurements at sea. The system provides the continuous measurement of salinity, temperature, dissolved oxygen, pH, plantpigments, turbidity, nutrients (nitrate, nitrite, phosphate and silica), pCO2 and radiation. The output is a major contribution to marine research with, in particular, the study of eutrophication and its effects, the development and testing of models, the research of climate change and ocean acidification. It can also be seen as the next step in the continuous monitoring of the marine environment.
In situ datasets can be freely downloaded from the Belgian Marine Data centre (BMDC).

OceanColour products and applications
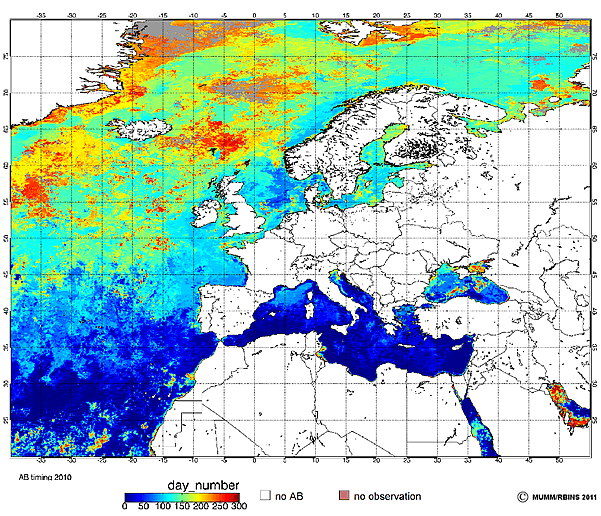
Chlorophyll a maps and Algae Bloom detection/timing
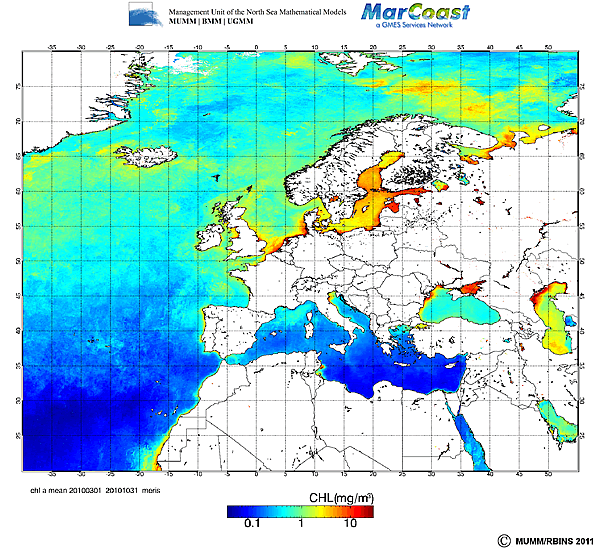
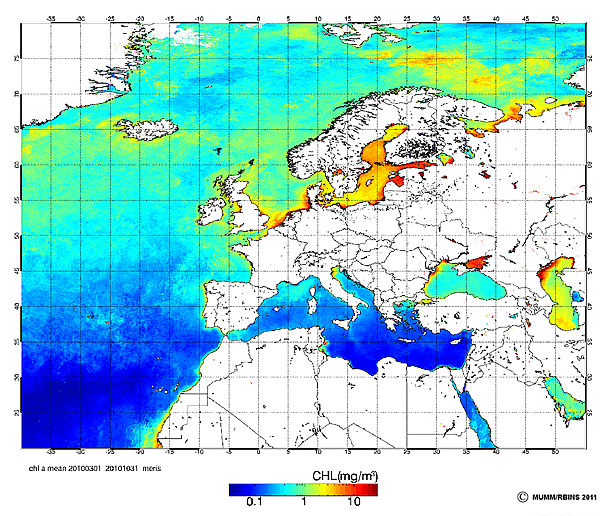
The purpose of REMSEM's services is to provide satellite-based support for the water quality assessment of chlorophyll a concentration. Satellite ocean colour observation provides daily maps of surface chlorophyll a concentration for the global oceans. REMSEM provides products based on multi-temporal analysis of chlorophyll a (CHL) products for different sub-regions of the North Sea and the Mediterranean Sea for use in eutrophication-related water quality reporting (OSPAR eutrophication strategy, EU Water Framework Directive, Marine Strategy Framework Directive). Products include monthly/3-monthly and annual mean and 90 percentile (P90) CHL products, algae bloom detection and timing products and time series of CHL at in situ monitoring stations. In addition, where required an expert analysis (descriptive report) is provided as tailored to the specific user/application. These products are generated within the MARCOAST 2 framework using specific temporal binning and classification procedures which are described in more detail on the project website which is mentioned in the section "Data availability / users support"
The Marine Strategy Framework Directive (MSFD) is currently the main driver for monitoring the coastal and offshore waters in Europe. It is one of the most important legal instruments of the European Commission to protect the marine environment including its ecosystems and biodiversity. It aims to achieve good environmental status of the EU's marine waters by 2020. Human-induced eutrophication is one of the criteria being assessed. It is defined as the (anthropogenic) enrichment of water by nutrients causing an accelerated growth of algae and higher forms of plant life to produce an undesirable disturbance to the balance of organisms present in the water and to the quality of the water concerned.
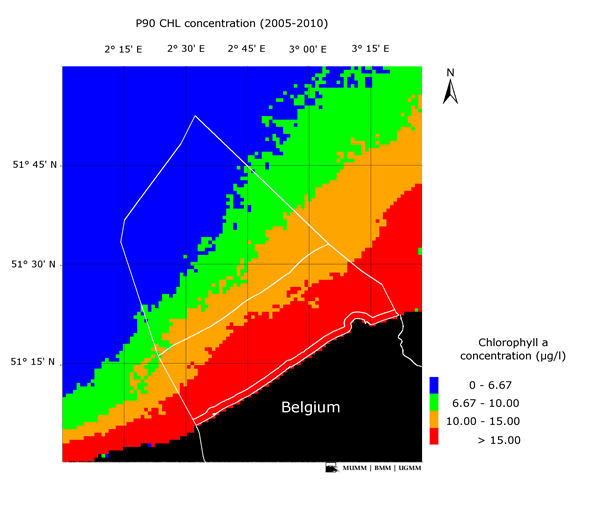
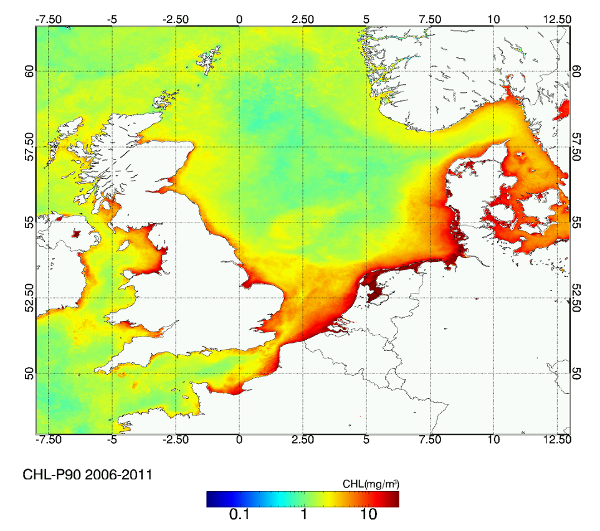
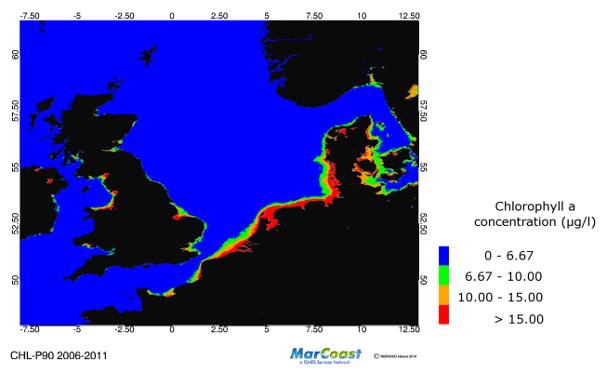
The eutrophication status is established by monitoring the chlorophyll-a (CHL) concentration as it is a proxy of phytoplankton biomass. More specifically, the indicator of choice is the chlorophyll-a 90 percentile (CHL-P90) over the phytoplankton growing season (i.e. March – November incl.) for a period of six years expressed in µg/l or mg/m³ (Fig. 1). The CHL-P90 is the CHL concentration below which 90 percent of observations fall. While in situ data acquisition is still considered as the main monitoring tool there is a growing tendency to use optical remote sensing as a supporting tool to achieve the monitoring requirements because of severe resource constraints of available ship time and manpower.
With the chlorophyll-a 90 percentile product (CHL-P90) product gaining importance, product quality has become an essential concern of the end-users. RBINS/OD Nature presents their latest progress made in optimizing the satellite-based CHL-P90 product for MSFD monitoring taking into account the irregular availability of satellite chlorophyll-a observations both in space and time due to cloudiness, quality flagging, sensor malfunction etc.
Total Suspensed matter (TSM)
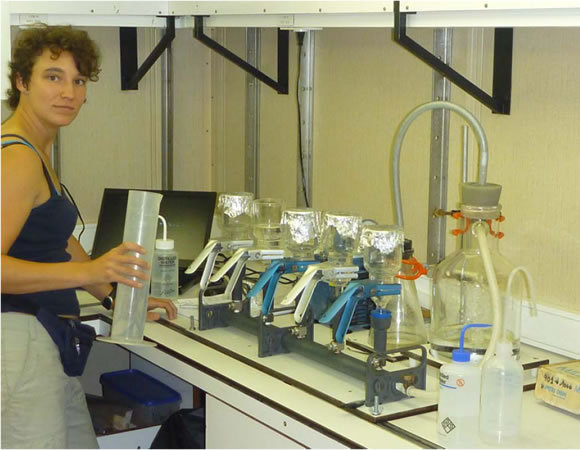
TSM is used to describe the dry weight concentration of suspended particulate matter and is measured by filtering a known volume of water on a glass fiber filter. Filters are then dried and weighed in the laboratory to obtain the dry mass concentration of particles, TSM. The term "Total" refers to inclusion of organic as well as inorganic matter, although it can be misleading since particles smaller than the pore size of the filter (usually 0.45micrometer) are not retained.
In remote sensing studies TSM is estimated via its optical properties assuming, either directly or indirectly, a constant relationship between particle mass and particulate (back)scattering or absorption. It is well-known that the relationship between particle mass and optical properties in reality varies as function of particle size and composition (refractive index) (e.g. Neukermans et al. 2011), giving an important limit on the generality and accuracy of remote sensing algorithms for estimating TSM. TSM is the parameter generally required for sediment transport applications.
Turbidity
Turbidity, as defined in the standard ISO7027, is a parameter that is routinely measured in many national and regional water quality monitoring programs. While satellite data products are beginning to become available for the closely related parameter, Total Suspended Matter (TSM), the direct estimation of turbidity as a satellite data product has not yet been addressed. In situ measurements of TSM and of turbidity, obtained in the Southern North Sea (SNS), show high correlation (correlation coefficient of 98.6%). A generic multi-sensor algorithm for TSM as function of reflectance has been developed and is extended to the estimation of turbidity from water-leaving reflectance. The algorithm was calibrated using a set of 49 seaborne measurements of reflectance in the spectral range 600-850nm and turbidity in the SNS. Validation of these models was carried out using an independent set of seaborne measurements of turbidity and reflectance and shows low relative errors in turbidity retrieval at 681nm (less than 35%). This wavelength is recommended, provided no significant fluorescence affects this range.

Nechad B., Ruddick K. & Neukermans G. (2009). Calibration and validation of a generic multisensor algorithm for mapping of turbidity in coastal waters. In: SPIE "Remote Sensing of the Ocean, Sea Ice, and Large Water Regions" Conference held in Berlin (Germany), 31 August 2009. Proc. SPIE Vol. 7473, 74730H. Download
Sediment transport (TSM)
At MUMM different numerical models are being developed for the calculation of the transport of the dumped dredging material at the Belgian coast. To better understand the dispersion of the material after dumping, MUMM develops sediment transport models to simulate this transport. The remotely sensed spatial distribution of suspended matter can be used to validate these models.
GRIMAS: a tool for Gridding and archiving of Marine Satellite data
GRIMAS is a set of generalized routines written in IDL, which can automatically process large numbers of MODIS and MERIS L2 files for any region on earth (described by 2 sets of bounding coordinates). Datasets are imported from the L2 files, projected on a custom generated grid (equirectangular projection), centered on the average latitude of the region. The gridded data can be easily exported to NetCDF files or mapped to PNG files. Extraction of time-series, match-ups and multi-temporal means from the archive of gridded data is also possible.
Data availability / users support
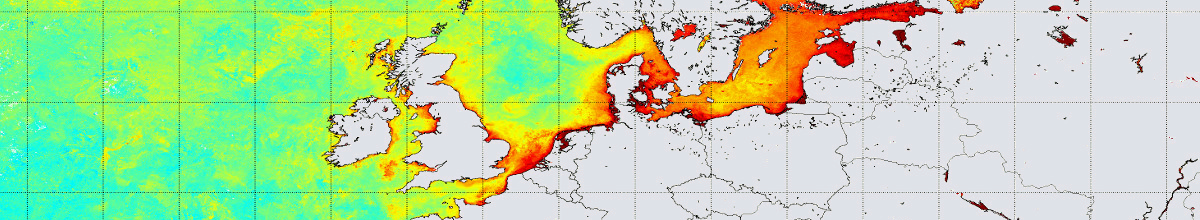
GRIMAS: Regional OceanColour archive
An archive of MODIS Aqua and MERIS RR level 2 images from the sensor's acquisition start in mid 2002 to the present was generated using GRIMAS, for three regions: the Southern North Sea and the Channel (SNC, 48.5°N - 52.5°N, 4°W - 5°E, including SNS and BCZ), the waters around Ireland (IRL, 50°N - 57°N, 2.5°W - 13°W) and the Catalan coast (CTL, 40.5°N - 42.5°N, 0.5°E - 3.5°E). Gridded datasets extracted from these archives are available on request, as are time-series (for given locations) and multi-temporal (daily/monthy/yearly) composites and climatologies (averaged over several years). Time-series extraction from a web-based interface is available including total suspended matter concentration, chlorophyll a concentration and sea surface temperature (MODIS only). Contact Quinten Vanhellemont for information on custom products and regions.

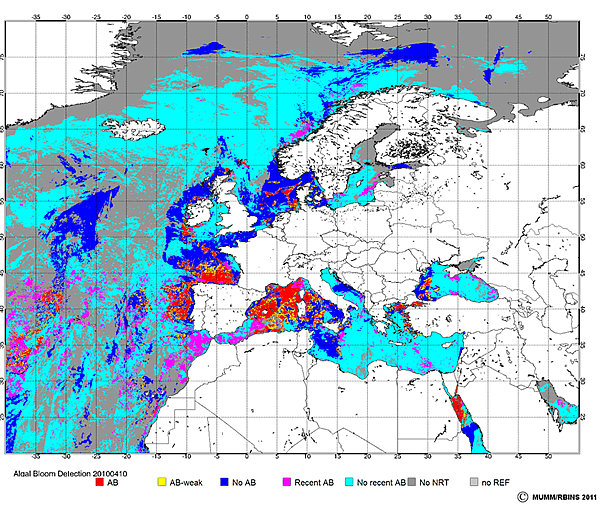
Multi-temporal chlorophyll a products / Algal Bloom detection and Timing products
REMSEM generates multi-temporal chlorophyll a products in the MARCOAST framework. We aim to make these Multi-temporal chlorophyll a products more accessible to a large community of fisheries and scientific institutions using REMSEM's MarCoast webportal. This archive holds the following products for the period 2003 to present:
- Weekly, 2-weekly, monthly, 3-monthly, and yearly chlorophyll a concentration maps (mean, P90, pixel count)
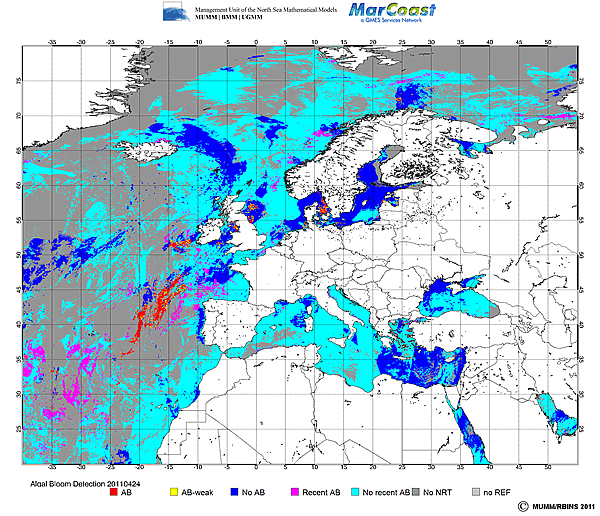
- Daily algal bloom detection maps
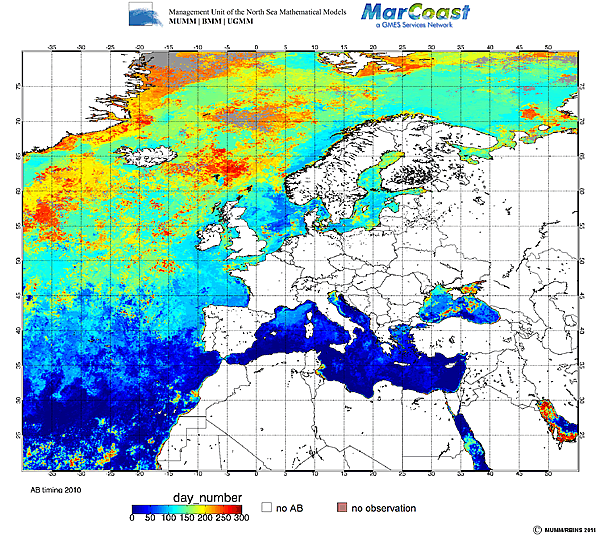
- Annual algal bloom timing maps
- Time Series of satellite-derived chlorophyll a concentrations can be delivered for specific locations on request
The area covered is lon = -8° to 13° and lat = 48° to 62° for the period 2003-2005 and lon = -40° to 55° and lat = 20° to 80° for the period 2006-current.
Contact: marcoast@mumm.ac.be