Scientific results
COASTAL WATER QUALITY MONITORING USING MULTI-SCALE SATELLITE DATA
High-quality satellite-based ocean colour products can provide valuable support and insights in management and monitoring of coastal ecosystems. Today’s availability of Earth Observation (EO) data is unprecedented including traditional medium resolution ocean colour systems e.g. (Sentinel-3/OLCI), high resolution land sensors (e.g. Sentinel-2/MSI) and geostationary satellites (e.g. SEVIRI). Each of these sensors offers specific advantages in terms of spatial, temporal, or spectral characteristics. With the availability of such diverse ocean colour products, the question arises on how to optimally integrate them to support marine monitoring applications. In Multi-Sync we developed advanced ocean colour products (i.e. suspended particulate matter and chlorophyll a concentration) through the optimization of satellite-based ocean colour products and the synergetic use of multi-scale EO data taking advantage of spectral characteristics of Sentinel-3 (S3), the high spatial resolution of Sentinel-2 (S2) sensors and the high temporal resolution of SEVIRI. A key element in this approach is the Data Interpolating Empirical Orthogonal Functions (DINEOF) technique developed to reconstruct missing data.
In a first step, multi-sensor ocean colour products were generated using optimized algorithms for optically complex waters as found in the coastal waters of the North Sea. This resulted in an archive of daily DINEOF gap-filled chlorophyll-a and suspended particulate matter concentration products covering the period 1998-2020 enabling supporting national eutrophication monitoring. Figure 1 shows that for the period 2014-2019 approximately 43% of the Belgian coastal zone was eutrophied. Analysis of the temporal and spatial evolution of chlorophyll-a and suspended particulate matter for the North Sea region showed that the spring bloom onset occurs approximately 1 month earlier in 2020 compared to 1998 due in part to rising water temperatures experienced globally (figure 2).
Next, DINEOF was adapted to handle high-resolution S2 including a novel approach to detect pixels affected by shadows from clouds or other structures with a success rate up to 85% (figure 3). This high-resolution DINEOF was integrated into the CMEMS high-resolution service which provides ocean colour products based on S2 data for all European Seas (i.e. Arctic Sea, Baltic Sea, North Western Shelf, Iberian Coast, Mediterranean Sea, Black Sea). This required the development of a specialized set up of the high-resolution DINEOF in a cloud-based processing environment (i.e. CREODIAS) for big data processing to ensure reasonable processing times. Figure 4 shows a monthly turbidity product for April 2020 covering all coastal areas of the European seas. Figure 5 shows the gap-filled turbidity product for the Belgian Coastal zone providing data on 23rd of April 2020 demonstrating the capacity of DINEOF to reconstruct marine features in high detail.
Finally, S2 and S3 data have been exploited to generate high spatial and temporal resolution synergy products by using a multi-scale DINEOF procedure providing a reconstructed dataset with a spatial resolution similar to the S2 data, even in dates when only S3 data were used. The approach was used to generate high resolution CHL products in the Belgian Coastal Zone, relevant for WFD eutrophication monitoring (figure 6 and 7).
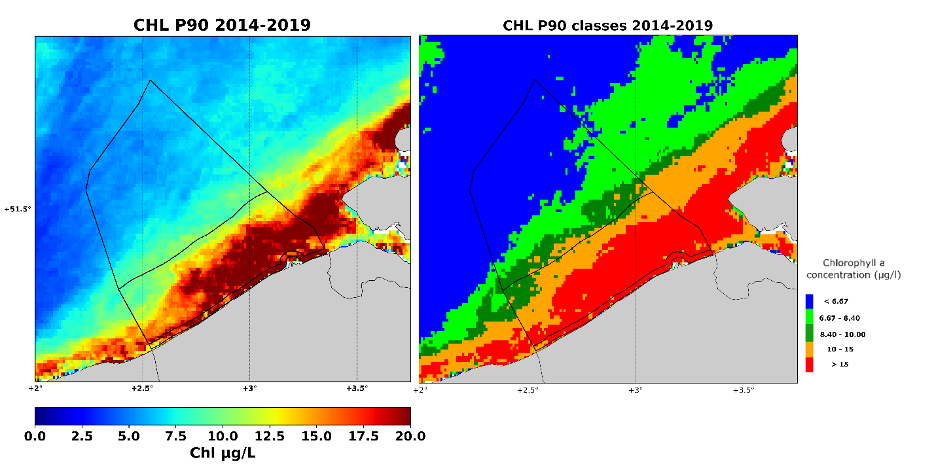 Figure 1.
(Left) The multi-temporal 90-percentile product of the chlorophyll-a concentration (CHL-P90) for the growing season March-October during the period 2014-2019 based on
satellite observations in the Belgian Coastal Zone. (Right) Classification of the CHL-P90 as an eutrophication indicator with the red class CHL-P90> 15µg L-1 indicating
the eutrophied region.
Figure 1.
(Left) The multi-temporal 90-percentile product of the chlorophyll-a concentration (CHL-P90) for the growing season March-October during the period 2014-2019 based on
satellite observations in the Belgian Coastal Zone. (Right) Classification of the CHL-P90 as an eutrophication indicator with the red class CHL-P90> 15µg L-1 indicating
the eutrophied region.
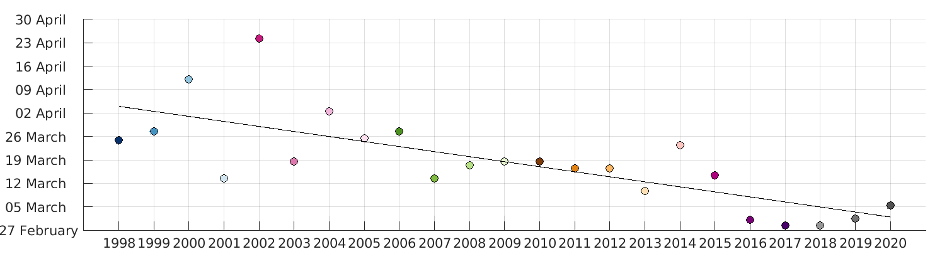 Figure 2.
Date at which the CHL concentration reaches the annual median value for the first time each year. The solid black line shows a linear fit to the dates, with r=0.75
Figure 2.
Date at which the CHL concentration reaches the annual median value for the first time each year. The solid black line shows a linear fit to the dates, with r=0.75
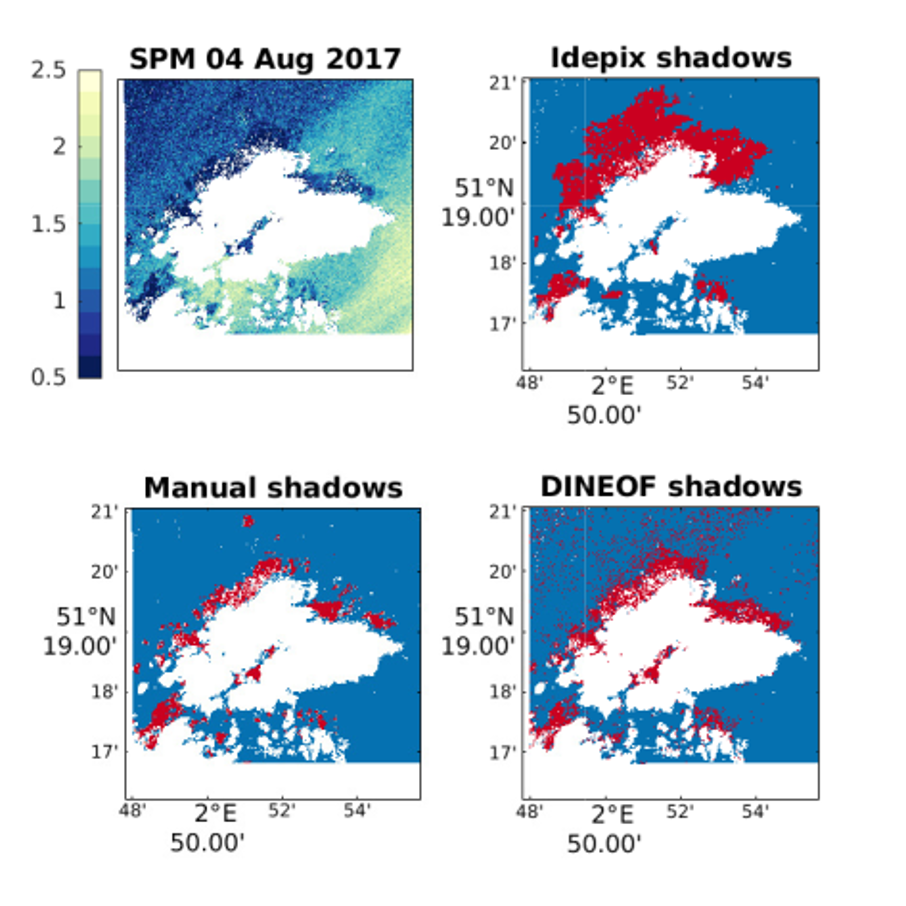 Figure 3.
Cloud shadow detection on 4 August 2017. Top left panel shows SPM values, with low values (dark blue) due to shadows, and clouds in white. Bottom left panel shows pixels
detected as cloud manually (in red). Top right panel shows the shadows detected by Idepix, and the bottom right panel shows the shadows detected by the present method.
Figure 3.
Cloud shadow detection on 4 August 2017. Top left panel shows SPM values, with low values (dark blue) due to shadows, and clouds in white. Bottom left panel shows pixels
detected as cloud manually (in red). Top right panel shows the shadows detected by Idepix, and the bottom right panel shows the shadows detected by the present method.
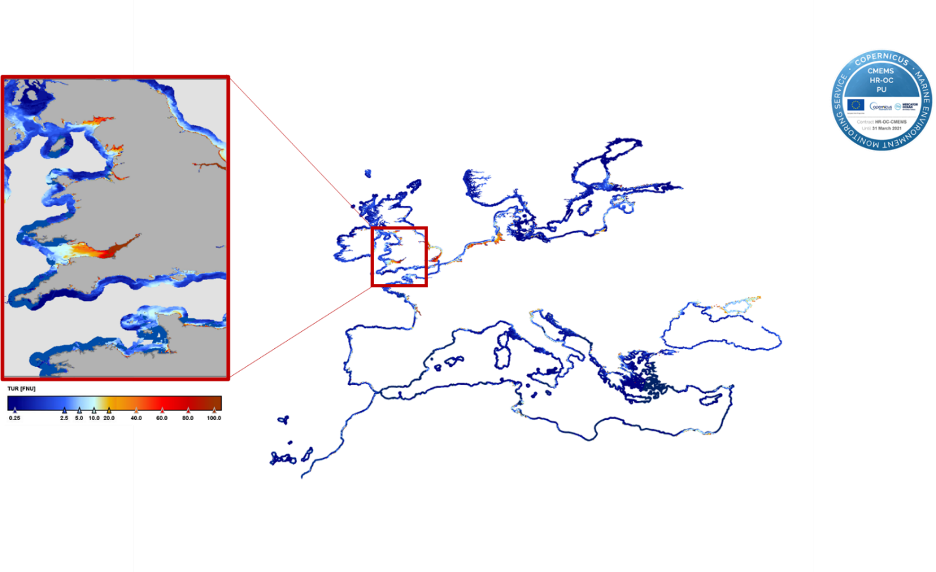 Figure 4.
CMEMS high resolution monthly mean turbidity product for April 2020.
Figure 4.
CMEMS high resolution monthly mean turbidity product for April 2020.
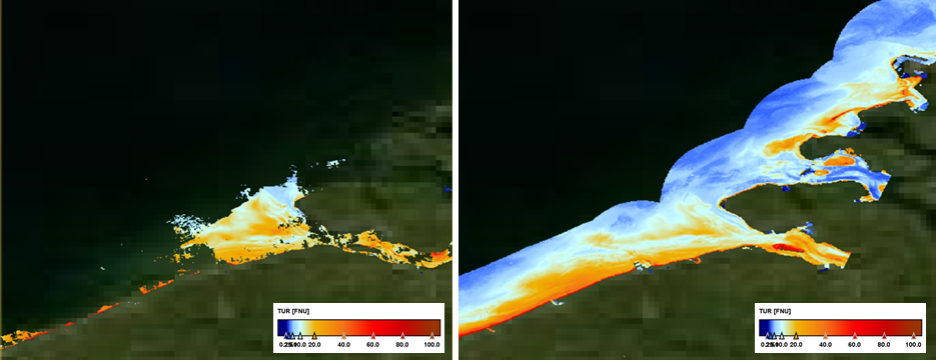 Figure 5.
. (left) CMEMS high-resolution L3 daily turbidity product for the Zeebrugge area (BE) for 23/4/2020. (right) CMEMS high resolution gap-filled L4D daily turbidity product
generated using the high-resolution DINEOF approach developed in Multi-Sync
Figure 5.
. (left) CMEMS high-resolution L3 daily turbidity product for the Zeebrugge area (BE) for 23/4/2020. (right) CMEMS high resolution gap-filled L4D daily turbidity product
generated using the high-resolution DINEOF approach developed in Multi-Sync
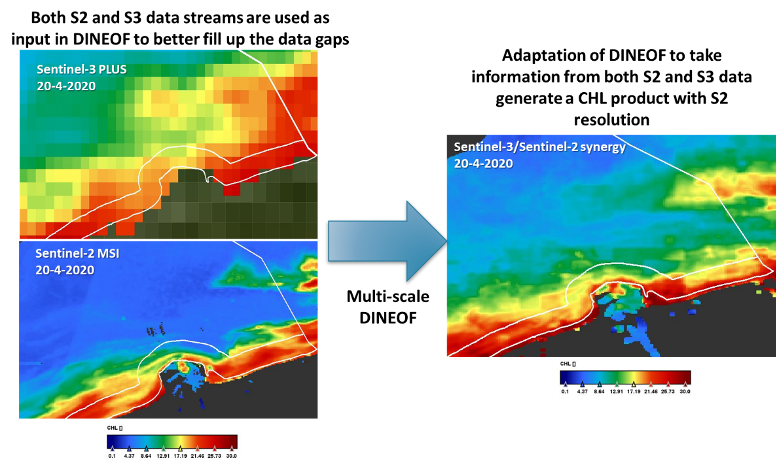 Figure 6.
. Demonstration of the multi-scale DINEOF approach applied to a S3plus CHL dataset combined with the CMEMS High Resolution CHL product based on S2 data for 20-4-2020.
The resulting synergy product shows fine scale spatial patters as observed by the S2 sensor with CHL values adapted based on the input from the S3plus sensor.
Figure 6.
. Demonstration of the multi-scale DINEOF approach applied to a S3plus CHL dataset combined with the CMEMS High Resolution CHL product based on S2 data for 20-4-2020.
The resulting synergy product shows fine scale spatial patters as observed by the S2 sensor with CHL values adapted based on the input from the S3plus sensor.
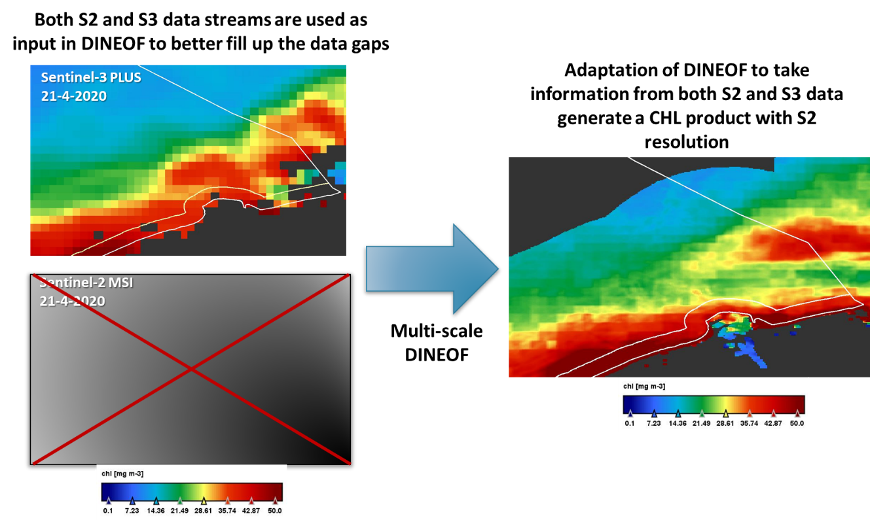 Figure 7.
Demonstration of the multi-scale DINEOF approach applied to a S3plus CHL dataset combined with the CMEMS High Resolution CHL product based on S2 data for 21-4-2020.
The resulting synergy product shows fine scale spatial without a matching Sentinel-2 image based on temporal information of prior or later days. This approach enables
the spatial upscaling of a S3plus image with 1km spatial resolution.
Figure 7.
Demonstration of the multi-scale DINEOF approach applied to a S3plus CHL dataset combined with the CMEMS High Resolution CHL product based on S2 data for 21-4-2020.
The resulting synergy product shows fine scale spatial without a matching Sentinel-2 image based on temporal information of prior or later days. This approach enables
the spatial upscaling of a S3plus image with 1km spatial resolution.